From text to diagrams: working with Mermaid
Mermaid turns structured text into diagrams, and back again. A practical look at text-first diagramming, and why it works well with language models.


There is something interesting about turning text into diagrams.
Not illustrations, but diagrams that express structure: flows, dependencies, sequences. This becomes especially noticeable when the text itself is not prose, but something closer to a script. Ordered sentences that describe relations rather than tell a story.
That is roughly the space where Mermaid sits.
Text as structure, not as explanation
Mermaid is usually introduced as a way to generate diagrams from text. That description is accurate, but incomplete.
What matters more is that the text is the primary artefact. You are not drawing shapes. You are describing relationships. The diagram is a rendering of that description, not the other way around.
Because of that, the process is reversible. You can always go back to the text, adjust it, and regenerate the diagram. Nothing is lost in translation.
This is different from most visual diagramming tools, where structure slowly dissolves into manual layout decisions. Once you start dragging boxes around, the model lives in your head rather than in the artefact. Mermaid keeps the structure explicit.
Mermaid is an open-source, text-based diagramming language created around 2014 by Knut Sveidqvist. It allows you to describe diagrams such as flows, sequences, and state machines using plain text, which can then be rendered into visual diagrams. Mermaid is not a formal standard governed by a standards body, but it has become a widely adopted de facto standard in documentation and developer tooling, much like Markdown. Its focus is on expressing structure rather than visual design, which makes diagrams easy to edit, version, and regenerate. This text-first approach is also why Mermaid works particularly well with modern language models, which can read, generate, and modify Mermaid syntax directly.
Low resolution, by design
I tend to think of Mermaid in the same category as Markdown.
Both are intentionally low-resolution formats. They do not try to look good. They try to stay readable, portable, and precise. You can open them in any editor, version them, diff them, or move them between systems without friction.
That constraint is not a drawback. It is what makes them durable.
The result is usually good enough visually, but strong in terms of meaning. For thinking, that trade-off is often exactly right.
What changes with language models
What makes Mermaid more relevant now than it used to be is that large language models understand it natively.
They can generate Mermaid diagrams from descriptions, modify existing ones, or explain what a diagram represents. That lowers the threshold for working with structured diagrams, especially when you are still figuring things out.
You can start with a rough explanation, ask for a diagram, adjust the structure in natural language, and iterate. The diagram becomes part of the thinking process rather than a final documentation step.
A tighter feedback loop
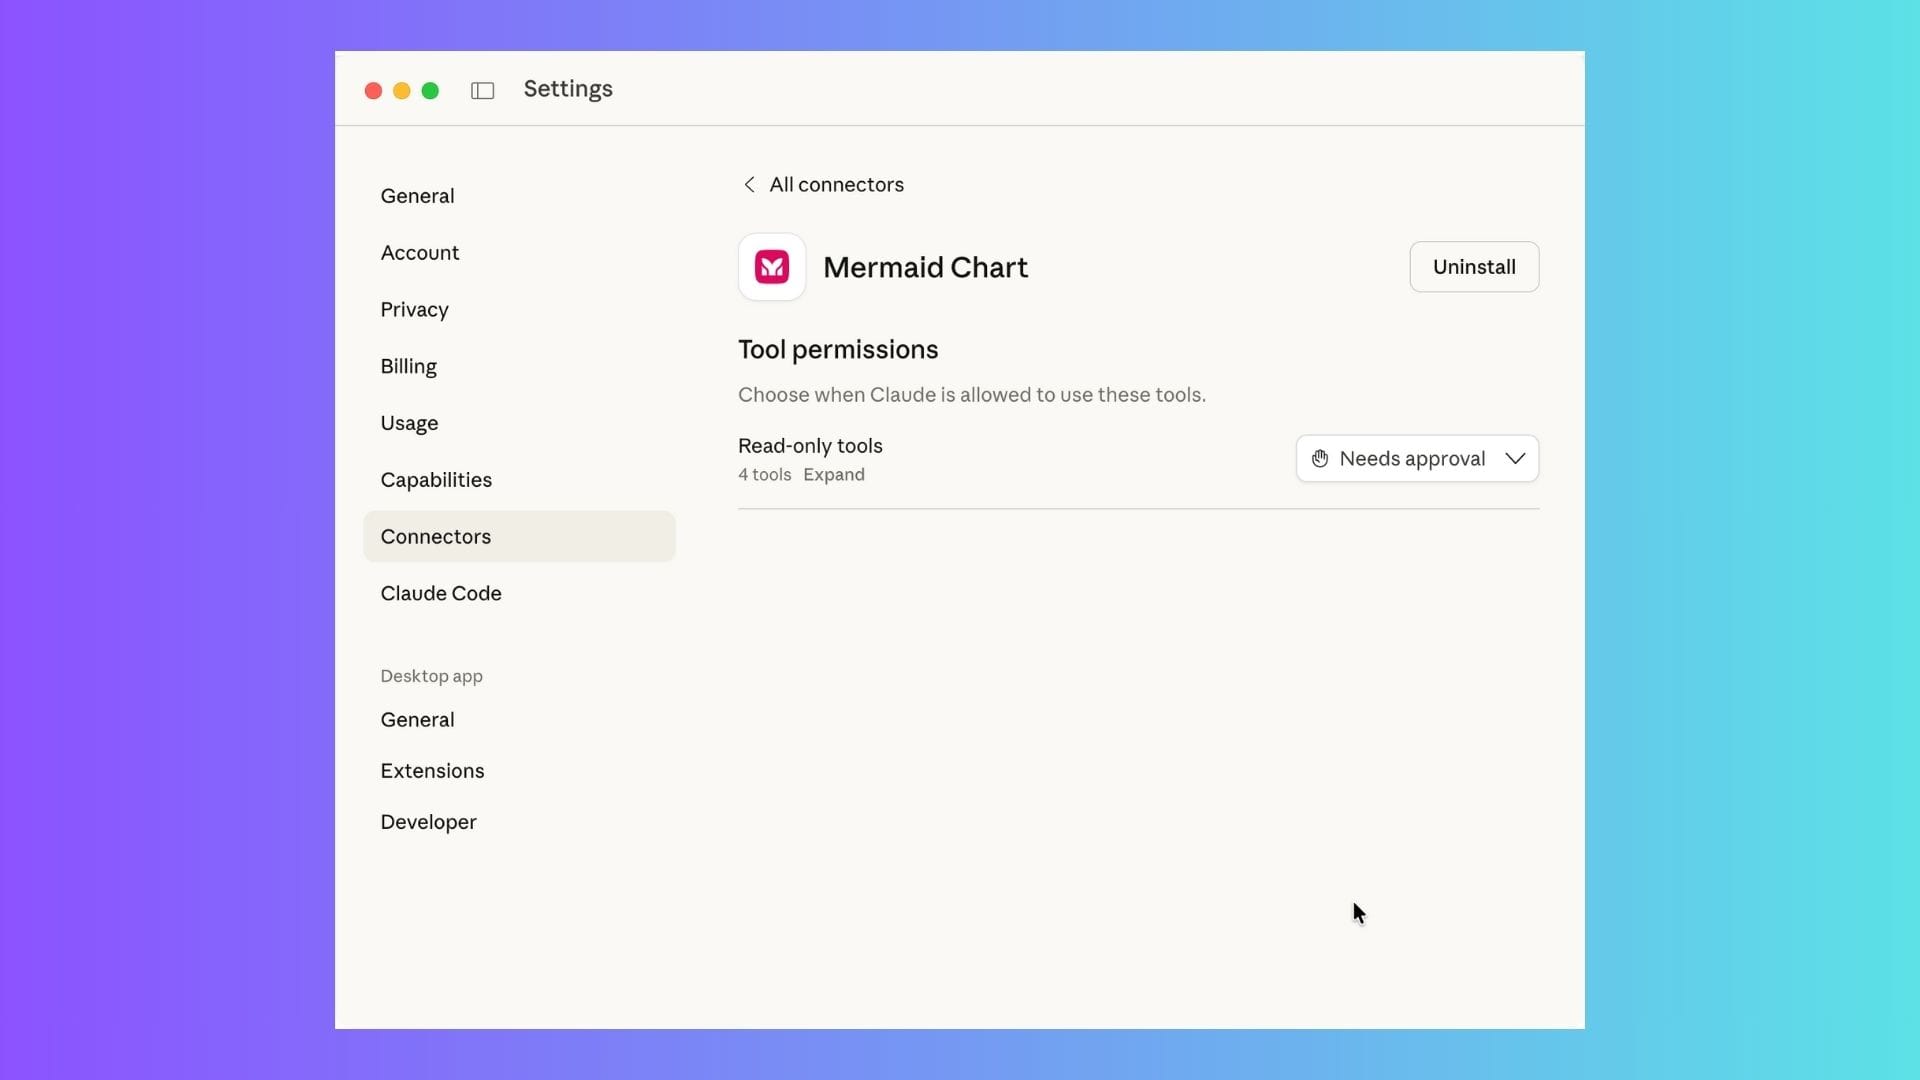
If you connect Mermaid generation into your workflow, for example via an MCP setup or similar tooling, that loop tightens further.
You explain something.
You get a diagram.
You adjust the structure.
You regenerate.
No redrawing. No exporting. No loss of intent.
This is particularly useful for architecture sketches, process descriptions, or system overviews that are still in flux.
Why it works for me
Mermaid is not a general-purpose diagramming tool, and it does not try to be one. It assumes that structure matters more than appearance, and that text is a reasonable place to express that structure.
If you are already comfortable working in Markdown, Mermaid tends to feel familiar rather than foreign.
And if you combine it with a language model, it becomes a practical way to move back and forth between explanation, structure, and visualisation with very little overhead.
Not a revolution. Just a tool that fits well with text-first ways of thinking.
I personally have a paid plan for this service:
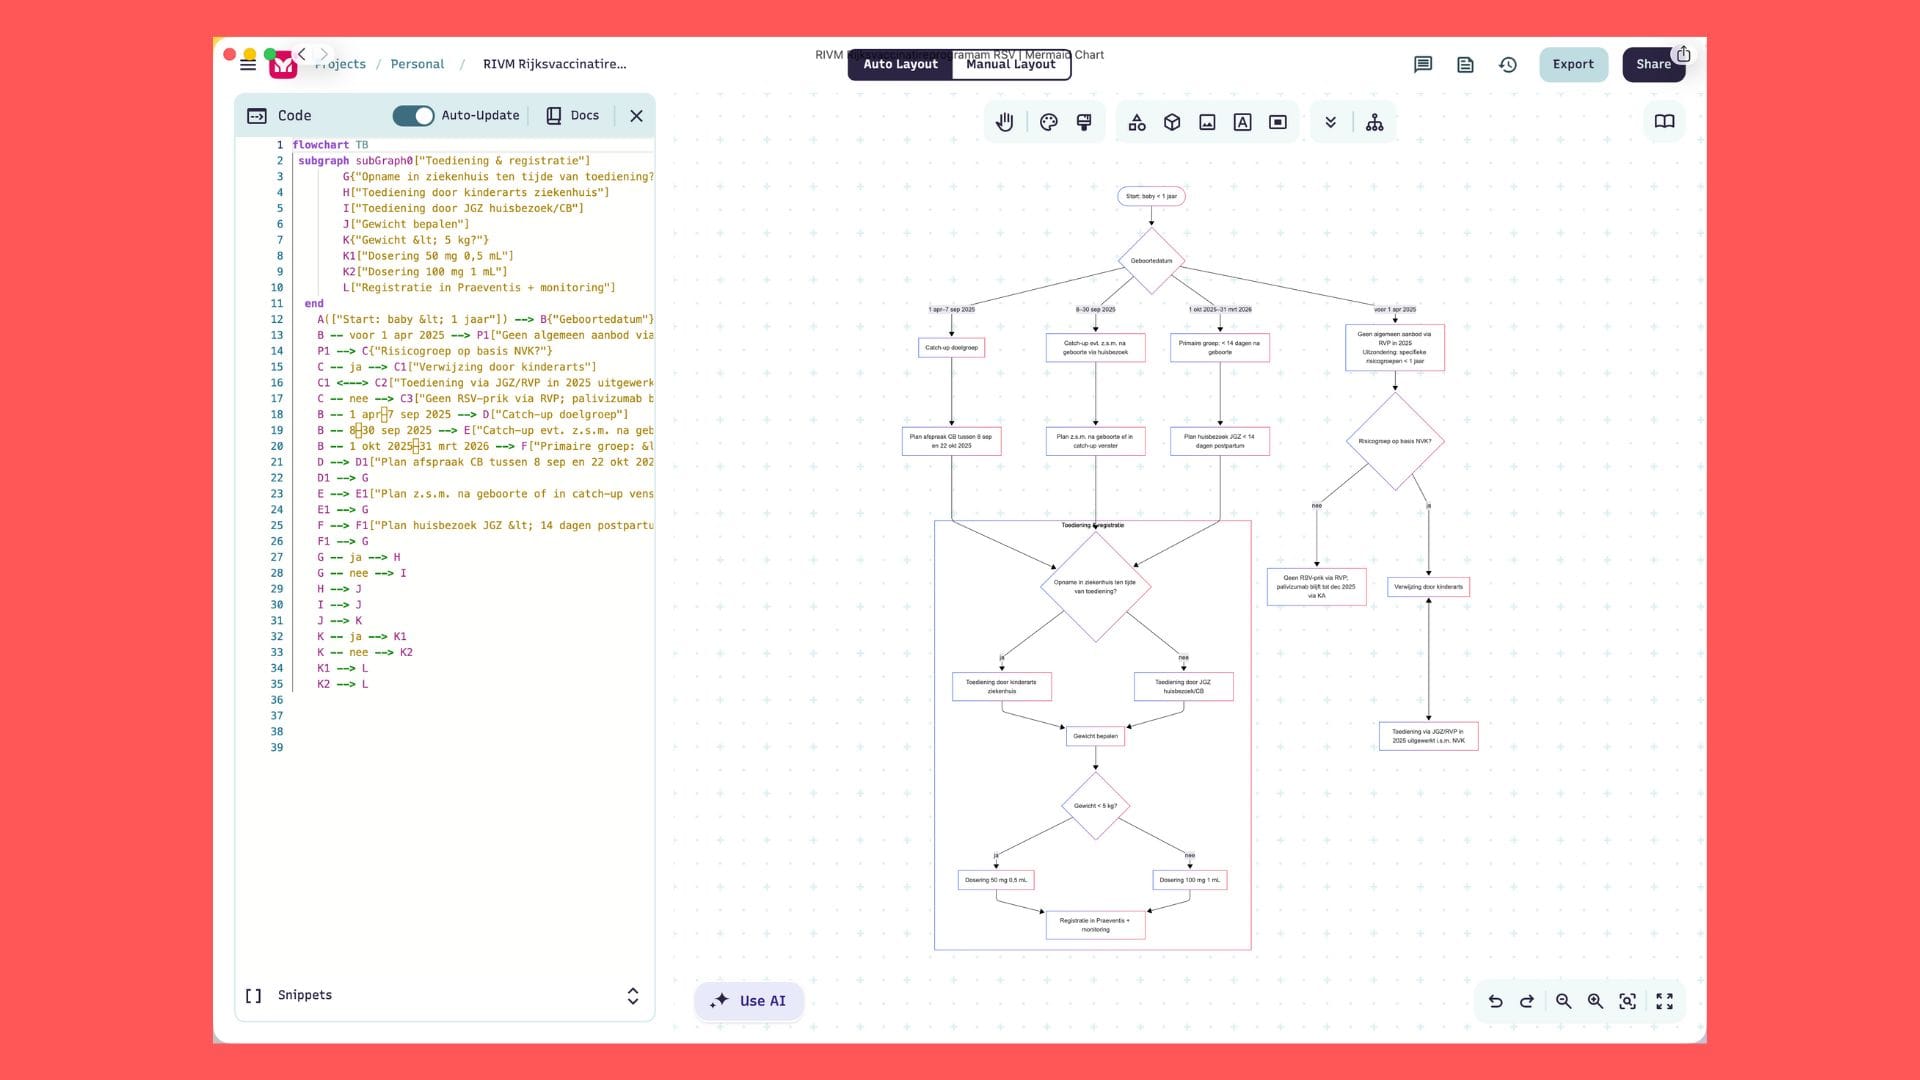
Het is a flowchart example. Textual script on the left, graphical output on the right.